
Why I Love Developer Tools
Doing web testing means that your primary tool for testing is a browser. Many testers respond to this challenge by loading up their browsers with extensions, as shown below.
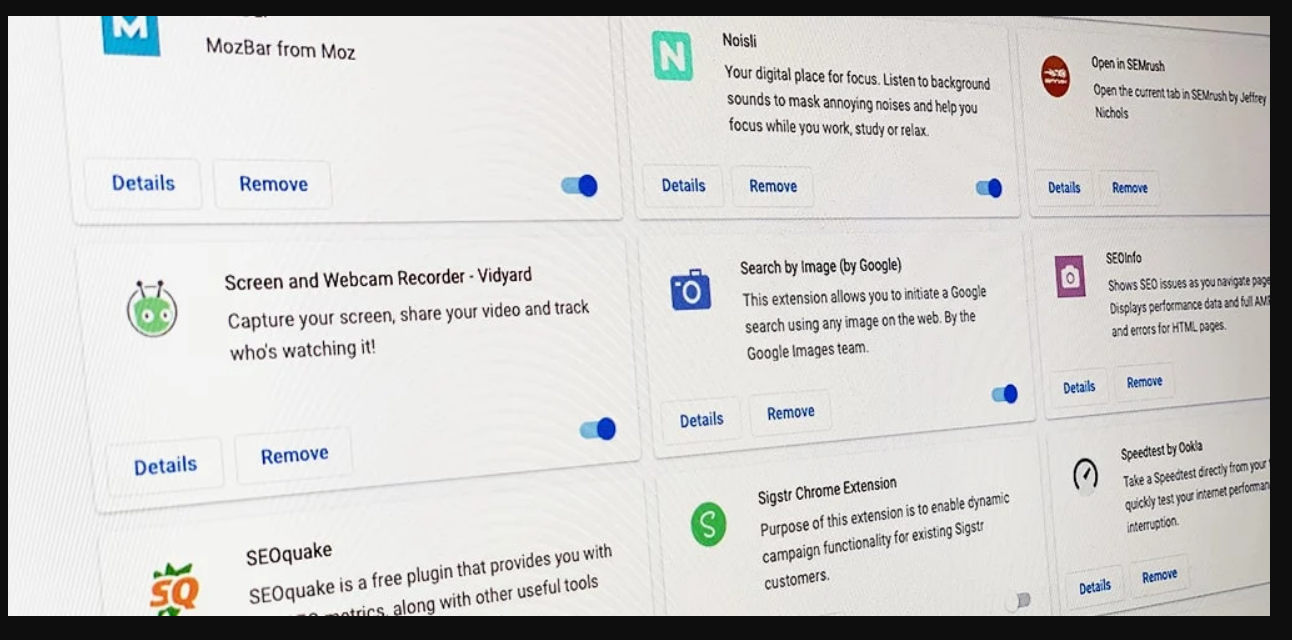
Spoiler Alert - All examples will be shown in Chrome, since it is, at this time, my favorite browser.
But what If I told you that most of what extensions offer can be done directly via the browser’s Developer Tools window? I remember like it was yesterday the day I discovered Developer Tools.

Contrary to the funny warning from Facebook shown above, urging me to STOP because this browser feature was intended for developer use only, I was curious to see what the developer tools were, what they could offer and, most importantly, what Facebook was so afraid of.
I have to admit that my enthusiasm flagged a little when I saw that the Developer Tools window contained a lot of tabs, each with their own features, each providing a different way to test an application. But as I went deeper in my exploration, I became more and more convinced that this was an indispensable tool for web testing. As the title of this article suggests, I am going to focus on one tab: the Network tab.
Introduction To Developer Tools: The Network Tab
All examples are based on the Restful Booker Platform web page. We’ll review the most popular tools as well as lesser-known ones that can make a difference if used at the right time.
Viewing Network Activity
To open the Network tab you need to first open the Developer Tools window. This can be done on Windows by pressing F12 with Chrome in focus. This will open the Elements tab by default.

For our purposes we need to select the Network tab. You just need to select Network and the Network tab will be opened. By default, the Network tab’s display (referred to below as the Network display) contains a list of all the requests that have been made to render the page.

If the Network display does not show any requests when you first open it, simply refresh the page.
Viewing Network Activity By Content Type
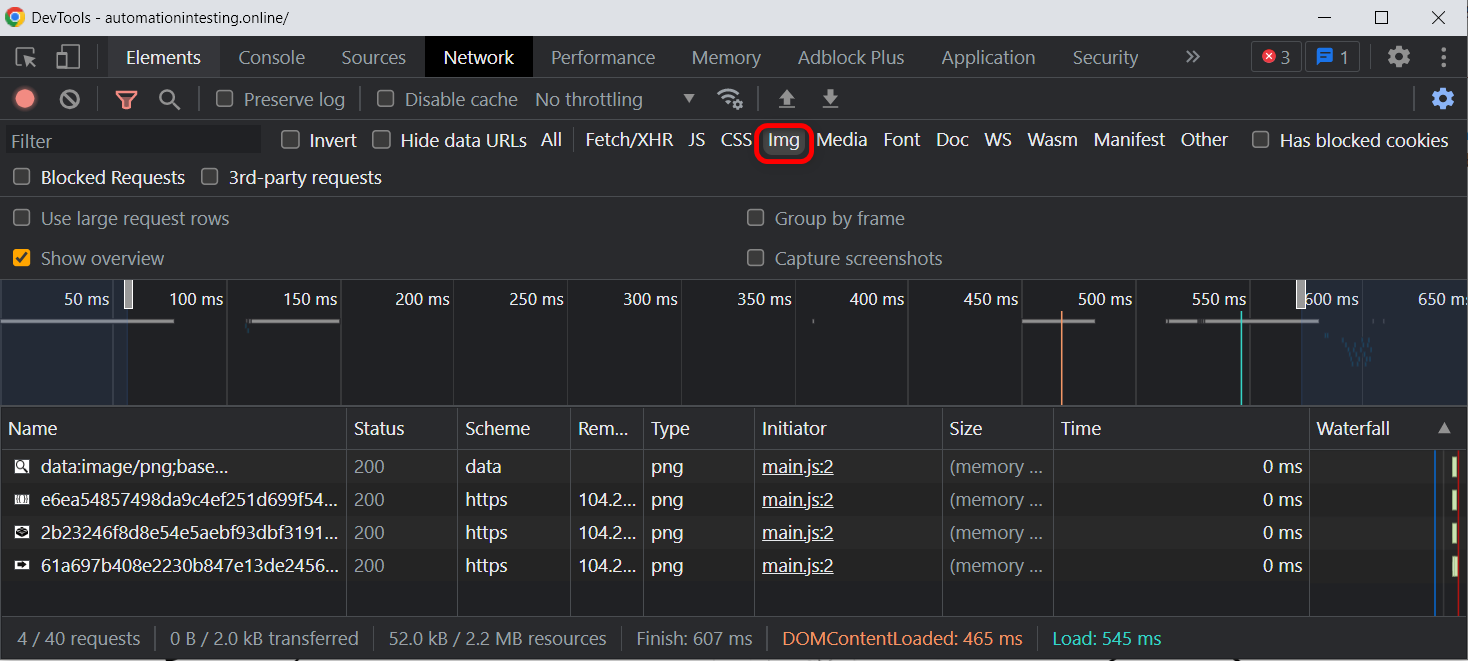
Underlying the display of a typical web page are dozens of requests. Viewing all those requests at once can be overwhelming! However, you can filter the requests based on content type just by selecting the appropriate tab.
For example, if you want to see all requests for images, select the Img tab in the Network display:
Using Advanced Filtering
You can improve your focus by filtering requests based on content type. However, there may be times when you have a lot of requests and want more filter options. This is the purpose of the Filter section of the Network display.
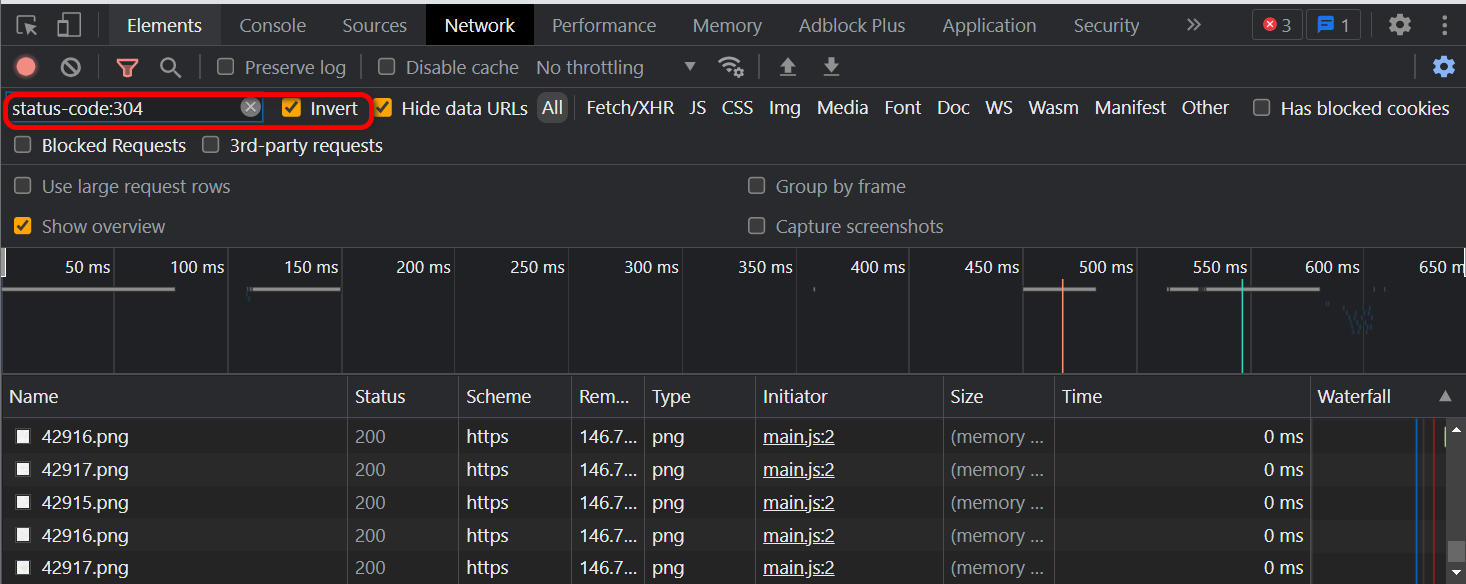
For example, you can filter on all requests that have a specific HTTP status code:
- Select the Filter text field:

- After that, enter Status:code:[status code such as 304] and press Enter.

Then you can invert your search by keeping your filter in place and selecting Invert. This will show you the requests that do not match your filters.
Click here to see the list of all supported Filters
Viewing Request Detail
Sometimes you want to make sure that what is displayed in the browser was in fact delivered from the backend.You can do this by searching for and exploring request details.
The web site that we are testing displays information on rooms. But is there a way to make sure that what we see is actually also what the server wants us to see?

To make sure that the data displayed was in fact delivered from the backend, we need to select the request and open its detail view.
We can do this by performing the following steps:
- Within the Network display, select Fetch/XHR as a type:

- From the result list, select room/ , since we want to see room data:

- To verify that the data matches, expand the Preview display. As we can see below, the data matches.

Searching For Requests By Specific Content
We saw above how to verify that request details were in fact delivered from the backend.
However, as you might have noticed, I filtered the request to show only Fetch/XHR requests. I could easily have checked if either of the two request responses contained the data I was searching for.
If you are not sure which entry to check, you can perform a text search on all network requests and then select the appropriate request.
First you select the Network tab to open the Network display:

Then you need to press CTRL + F to open the Search user interface:

After that, enter the text that you want to find and select enter:
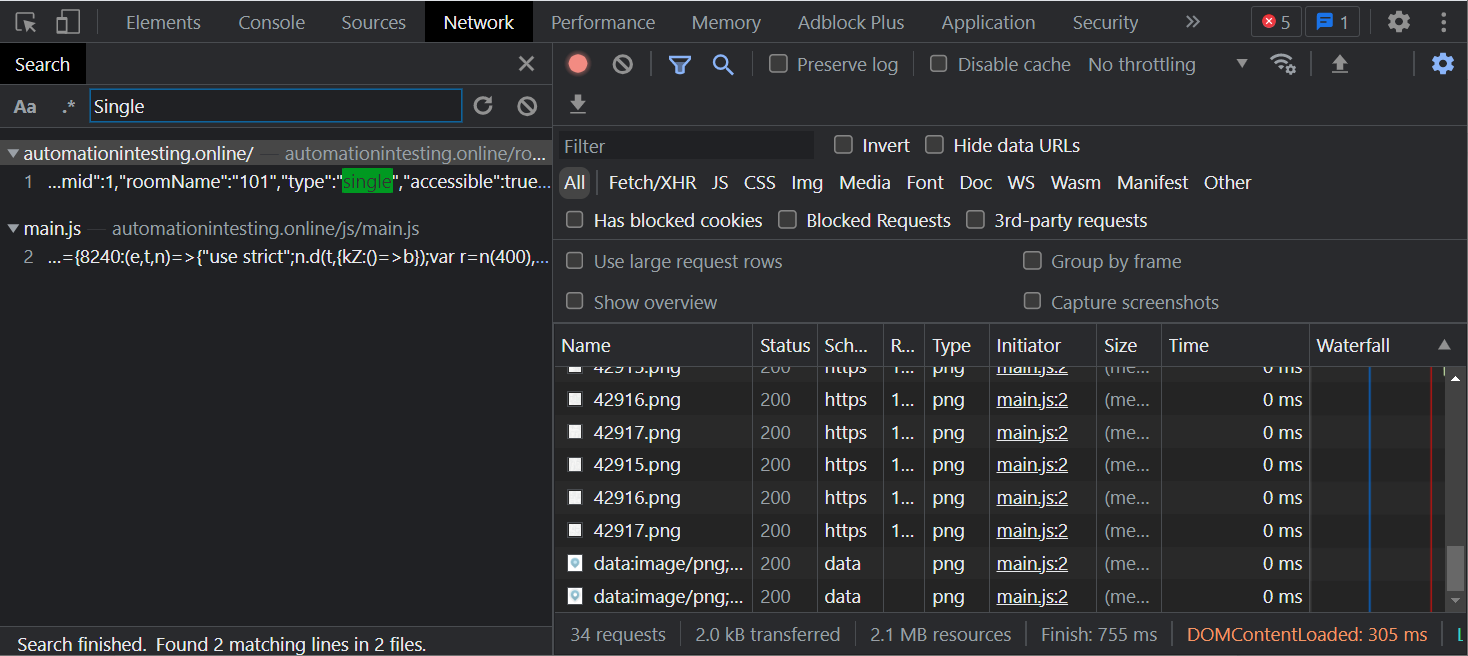
See below the results returned for the text Single:

Simulating Real-World Use Conditions
The Network tab offers some great ways to simulate typical use conditions for users with all kinds of configurations and network conditions. Personally, I’m used to browsing the Internet with a minimum connection of 400 Mbps, so sometimes I can’t understand why certain features on websites do not behave as expected.
Specifying Network Speed
You can simulate different network speeds either with predefined values or custom speeds. Below, Slow 3G is selected.
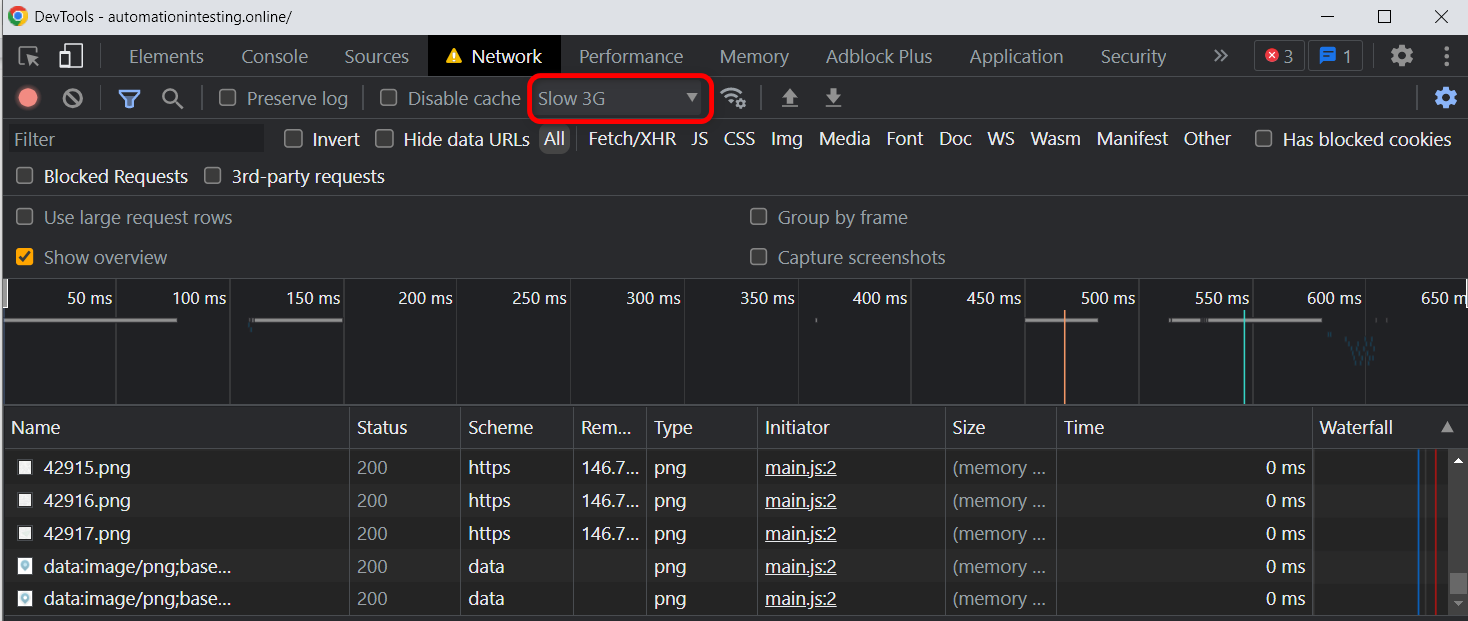
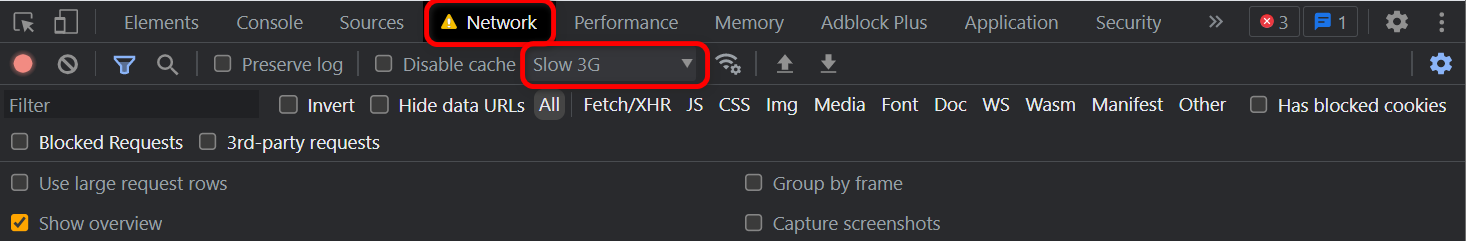
You can see that the simulated speed setting is on by the exclamation mark next to the network tab.
You can also check if the site works offline. Just select Offline under Presets in the same dropdown. In our case the site will not render at all.
Simulating Blocked Requests
Sometimes you want to start testing before the entire application is delivered, or if you want to know how the application behaves in case a request or a resource is not reachable.
For this purpose, you can use the Block request functionality in the Network display. You simply need to select the request that you want to block and choose to block one request or a domain.

After you have selected the desired option, you simply need to refresh the page to see the results.
Before blocking on request URL:

After blocking:

Copying And Re-using Requests
As a last argument to convince you that the Network tab of Developer Tools is the one to rule them all, I present to you the ability to copy and re-use any request that you can see in the Network display.
In our test site, there is a form at the bottom of the page. It sends a request to the server when you select Submit.

To copy the request, you need to select the request, open the Copy menu, and select Copy as cURL (cmd).

If you want to see what each option does, see an explanation of each item in the copy list.
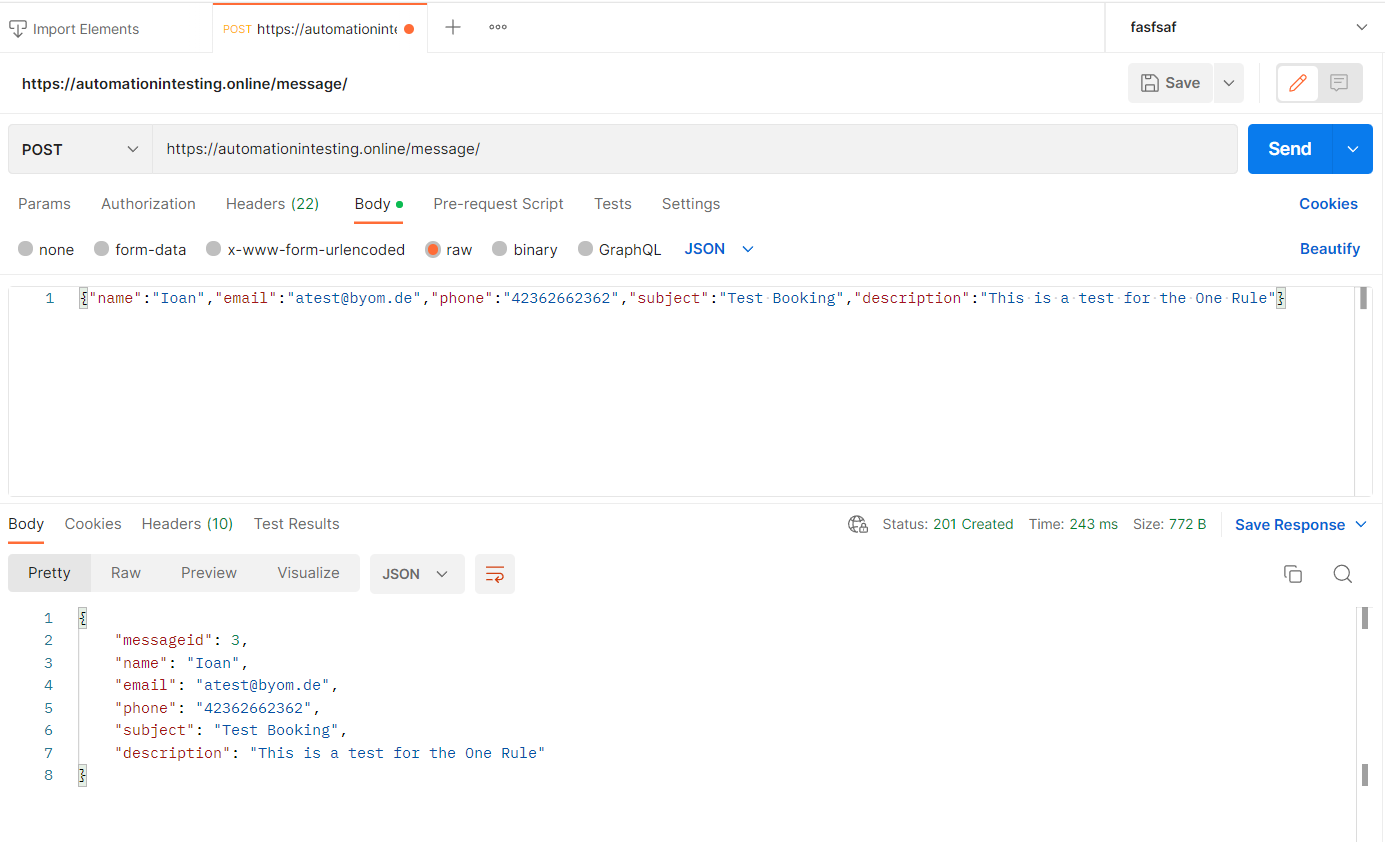
With the request copied, you can open an API testing tool such as Postman. Within Postman, you would select Import, then Raw Text, and paste the request into the text field.

After the import is complete, you can re-use the request information to perform other tests in Postman.
Prove Me Wrong! Try It Yourself.
In case you are not yet convinced that the Network tab of Developer Tools is the best tab out there, I encourage you to prove me wrong. Explore and check each point one by one and comment whether or not you agree!. Create your own list for other tabs and prove me wrong in the comments. At the end of the day, we will all win something from the exchange, and that is knowledge.
For More Information…
- Checklist for Testing Web Page Functionality, Lena Pejgan Wiberg
- But I'm Not A Security Tester! Security Testing On The Web For The Rest Of Us, Kate Paulk