load quickly or the links don't lead to the right sites. This article discusses some of the free tools developers can use to create highly functional and well-optimized websites, not just for testers.
I have used the following tools for various types of performance-related testing. Here’s what I thought of them.
PageSpeed Insights
Browser: Google Chrome
Devices: Desktop and mobile
Use Case: Performance testing of mobile and desktop websites (Chrome only)
This tool from Google offers testers and web developers insights into the functionality and usability of websites. It is free of charge and web-based, and it analyzes the performance of a web page, generating detailed reports on load time and user experience. The tool provides scores ranging from 0 to 100 with higher scores indicating better performance.
PageSpeed Insights provides information based on a variety of metrics, including first contentful paint, largest contentful time, total blocking time, cumulative layout shift, and speed index:
- First contentful paint is the amount of time elapsed from the point when a user first navigates to a webpage to the point when the first piece of content is fully loaded.
- Largest contentful time is the time that takes to load the largest visible block of content to appear on the screen.
- Total blocking time is the total amount of time after first contentful paint that the page is blocked from user interaction.
- Cumulative layout shift is the sum of the all unexpected layout shifts that occur during the lifespan of the web page interaction.
- Speed index quantifies how quickly the visible elements of a web page are populated during the page load.

All you have to do is open https://pagespeed.web.dev/ in a browser, load your website address into the input form, and select Enter. Both desktop and mobile devices will be able to access the results. To examine the results for various sorts of devices, simply navigate through the tabs.
PageSpeed Insights also offers recommendations for the types of adjustments that could be made to speed up the page load even further. These recommendations can be seen under the Opportunities section. The Diagnostic reveals which locations resulted in unnecessary cause of loading issues, such as JavaScript execution time, third-party code usage, and so forth.
One downside: since PageSpeed Insights was created by Google, it mainly offers insights and suggestions based on how well web pages run on Google Chrome.
URL: https://pagespeed.web.dev/
Screamingfrog
Browser: Google Chrome, Firefox, and Edge
Devices: Desktop and mobile
Use Case: Performance testing of mobile and desktop websites
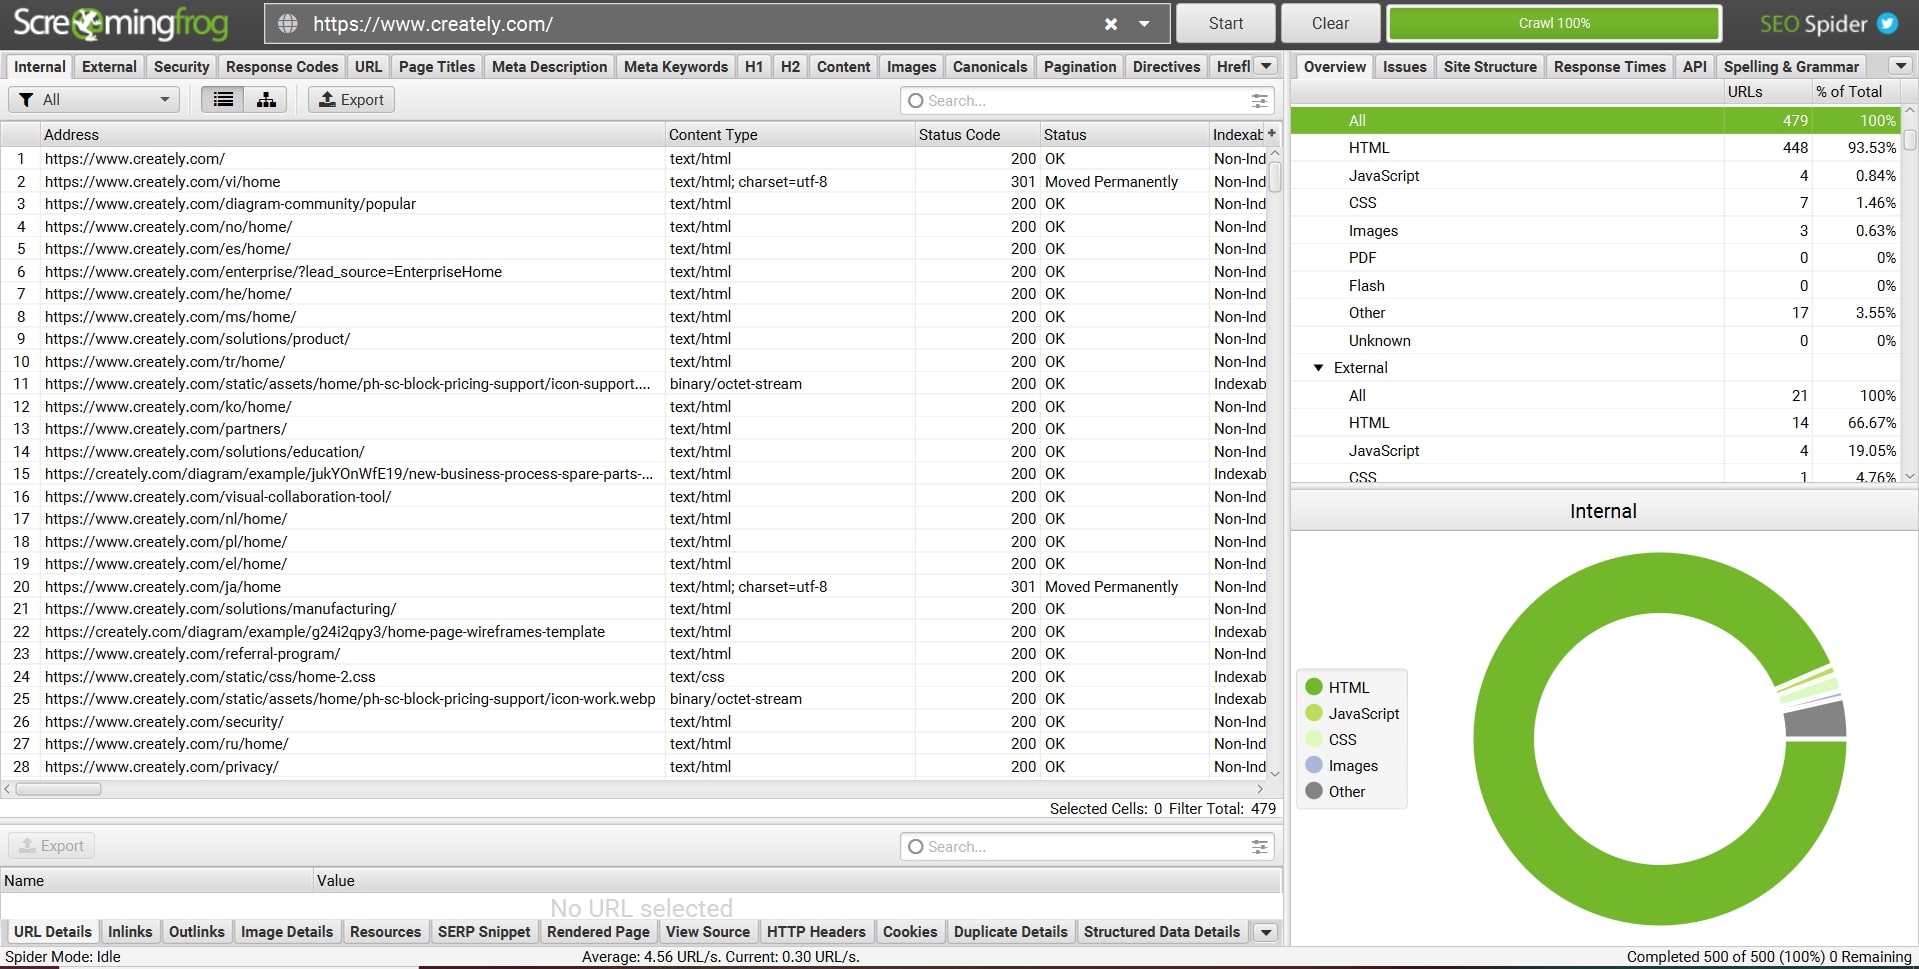
This tool is intended largely to measure SEO effectiveness. However, it also makes page optimization and website analysis easier. Screaming Frog gives users information on page speed and makes it possible for them to see problems like broken links and duplicate material.
Screamingfrog can assist you in identifying user experience problems, including poor page loading, lack of mobile friendliness, and accessibility deficits. It also provides a feature to check for broken links.
One of this tool's shortcomings is that testers generally don’t need its SEO capabilities, which are one of the product's key features. Additionally, as this is a standalone utility, you must install it on your device to use it.
URL: https://www.screamingfrog.co.uk/seo-spider/
GTmetrix
Browser: Google Chrome and Firefox
Devices: Desktop and mobile
Use Case: Performance testing of mobile and desktop websites
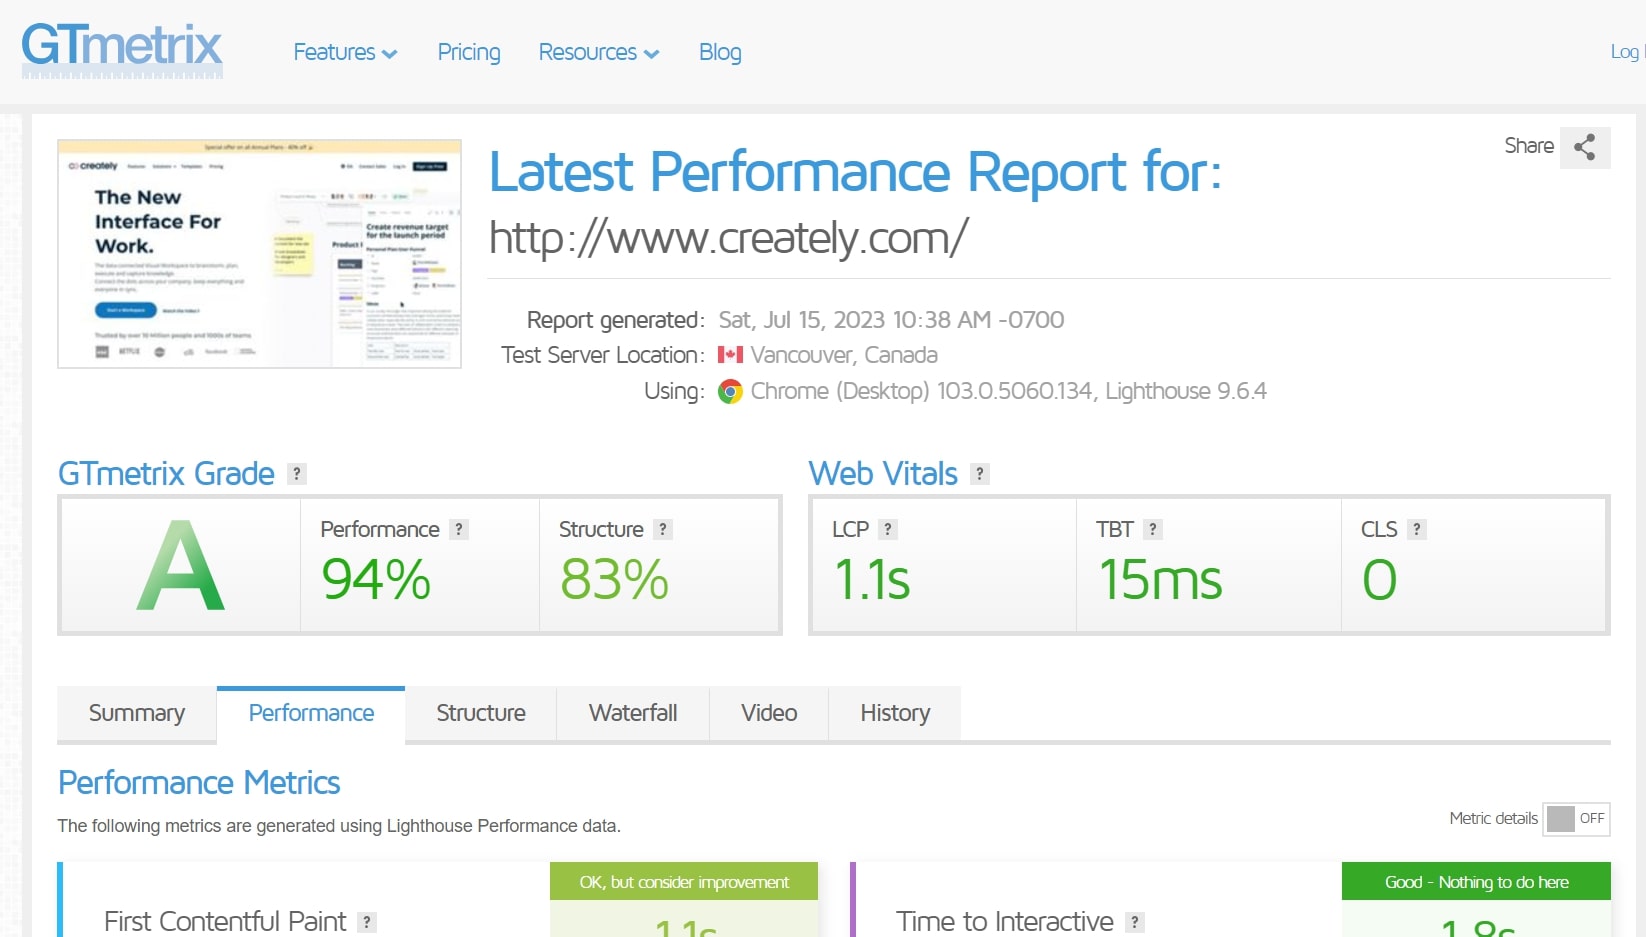
GTmetrix is another powerful web performance analysis tool that provides valuable insights into website speed and optimization. It provides thorough guidance to help website owners and developers improve the functionality and user experience of the website. You can use the tool as a guest user without logging in or signing up. However, creating an account offers additional options and advantages, such as continuous monitoring of page performance, alert system to notify you of any underperformance, and PDF report download.
It displays information on first contentful paint, largest contentful time, total blocking time, cumulative layout shift, and speed index. In addition, GTmetrix includes several unique capabilities, like Compare, which lets you compare a web page's current speed with its previous most recent report. Using the Monitor feature, users can schedule GTmetrix to analyze a page on a routine basis. And it creates alert notifications when the monitored page test results meet the defined thresholds.
One main drawback of this tool is that not all the features are free of charge. But the primary features can be used for free. Just keep in mind that if you want to experience all the features offered, you need to upgrade to a paid plan.
URL - https://gtmetrix.com/
Dead Link Checker
Browser: Google Chrome and Firefox
Devices: N/A
Use Case: Broken link checking for web pages

One common issue that website owners and administrators face is broken links, also known as dead links. Broken links are hyperlinks that point to nonexistent or inaccessible web pages. These result in a penalty with regard to search engine rankings, not to mention poor user experience. Dead Link Checker can help you avoid all these problems.
Simply enter the URL into the input field provided on the page, then choose whether to check the whole website or only a specific single webpage. Then the tool will start analyzing the given URL, providing information on the broken links on the site or page.
If you create a free account, you can check multiple sites at the same time. Registered users also have the ability to send the test reports automatically to the email address they specify. Scheduled monitoring on a regular basis requires a paid plan.
URL - https://www.deadlinkchecker.com/
Lighthouse
Browser: Google Chrome (Extension)
Device: Desktop
Use Case: Performance testing of mobile and desktop websites (Chrome only)

Similar to other tools, this tool provides insights based on various metrics. But its main drawback is that it is a Chrome extension. Also, unlike other tools, this tool doesn’t have the auto-check feature where the web page under test is frequently monitored for any underperformance.
To use this tool, install the extension. Then, open the webpage you want to test. While still in the same tab, use the Lighthouse tool to generate a report.
URL: https://chrome.google.com/webstore/detail/lighthouse/blipmdconlkpinefehnmjammfjpmpbjk
Conclusion
I have used these tools to check the performance of web pages while doing manual testing. Websites can be automated to perform such testing as well. But the tools I’ve discussed above are available for manual testing. You can choose the tool that suits your needs best. Sometimes, you might only need to check for broken links, and in that case the Dead Links Checker is the best option.
Overall, using multiple performance testing tools provides more comprehensive analysis than a single tool alone, ensures data accuracy, and allows for diverse testing approaches. These tools are helpful for both testers and developers.
It is always advisable to do some performance testing before releasing any feature to QA for testing. As always, finding issues before release to production will save team members’ time and effort.
For Further Information
- Software Tools For Easy, Effective Exploratory Testing, by Mirza Sisic
- A Software Tester's Guide to Finding & Testing Broken Links, by Melissa Eaden