The forgotten part of quality: paying attention to production
Integrate monitoring, observability, and alerting into the core quality engineering process to ensure systems are as diagnosable as they are functional

In quality engineering, our job isn’t to test quality into a system. It’s to engineer systems that make quality visible.
This doesn't stop at the end of the CI / CD pipeline. We need to make sure that when things go wrong in production, and they will, we detect them, understand them, and resolve them, all before the business feels the impact.
To do that, we need to treat monitoring, observability, and alerting as core components of quality.
Definitions
Before we dive in, here are some quick definitions so we all start on the same page. I go deeper into each of these activities later in the article.
Monitoring is the collection and tracking of metrics, or aspects of the system that we can measure.
Observability refers to our ability to understand the behaviour of the system, and includes logs, traces, and other diagnostic data.
Alerting is notifying the team when the system we are monitoring breaches expected thresholds so that they can investigate and respond quickly.
Isn't looking after production a job for the developers?
Sure, but so is writing good-quality functional code. We don't simply leave developers to code in a vacuum; we provide them with frameworks, feedback loops, and guidance to ensure they do it right.
Why would we stop there? Why wouldn't we help ensure that the experience of understanding why a system failed is just as smooth as the experience of building a new feature?
Monitoring, observability, and alerting: a deeper dive
While these terms are often used interchangeably, they are distinct practices that, along with alerting, are the basis of an observability platform.
Monitoring
Good monitoring tells us important information about user experience and business impact. For example:
- Are users completing their key journeys?
- Is the basket (shopping cart) abandonment rate increasing?
- Are journeys slower than they were yesterday?
Modern monitoring systems even allow us to run "synthetic monitors." These often look like tests because they are scripts that execute part of the product code and assert that an expected behaviour is the result. Most often these are API-driven tests, but there are systems where you can use familiar tools like Playwright to create browser-driven tests that act as a monitor.
We can gain other valuable insights from monitoring too: CPU, memory, or disk usage, for example. However, it is important to remember that when these are the only types of metrics we get from monitoring, and we can't relate them back to real user experience, then it doesn't matter how many “green” metrics we have. Our monitoring is poor.
From the field: metrics with purpose
Just because your infrastructure is saying everything is green, doesn’t mean things are really working. Synthetic monitors have proven time and again to be valuable tools that highlight real issues long before other metrics can.
I remember a time where a synthetic monitor alerted us to an intermittent issue with system availability, but only in one very specific area of a client site. The monitor was flip-flopping between passing and failing. This type of thing can easily be written off as noise, but if you have high-quality monitoring in place, you know it is a sign of something going wrong. We investigated and found a real problem that we were able to resolve before it had any significant impact on revenue.
Can you guess what was wrong? I’ll share more in the Observability section.
Observability
The goal of good observability is to be able to explain why the system behaved a certain way. Or to put it another way, observability is all about high-quality, useful logging.
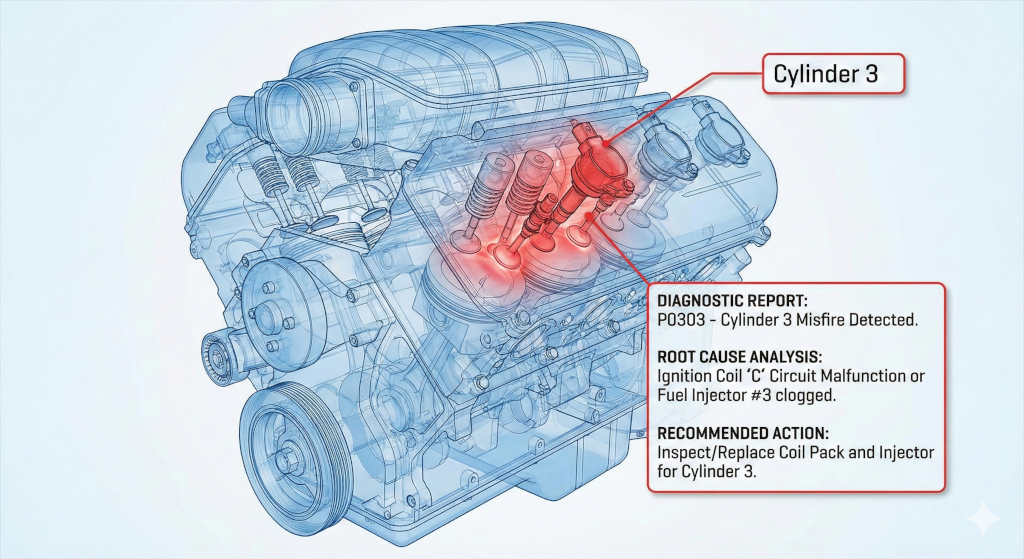
For example, take a payments system where a payment has failed to process completely. A good observability system will have correlation IDs (or similar) that allow us to trace the request, identify which service rejected it, and see exactly what data caused the rejection.
Without observability, debugging becomes guesswork and fixes become mere experiments.
From the field: intermittent system availability
I mentioned in the Monitoring section that our synthetic monitor was flip-flopping between green and red. We had confidence in our monitors, so we knew this meant there was a real issue, but it was our observability that made it easy to find the problem.
Thanks to our synthetic monitors, we had clear time stamps to investigate, and it quickly became clear what the issue was. Our logging showed us that when the synthetic monitor was green, we were hitting one side of an A/B test, and when they were red, we were hitting the other side. The issue was a simple misconfiguration in the split test that caused the users on the B side of the test to be unable to access the product. By switching off the test until it could be reconfigured, everything went back to normal.
Having clear events and logs in our observability platform, combined with our synthetic monitors, made it quick and easy to find the root cause and resolve the issue.
Alerting
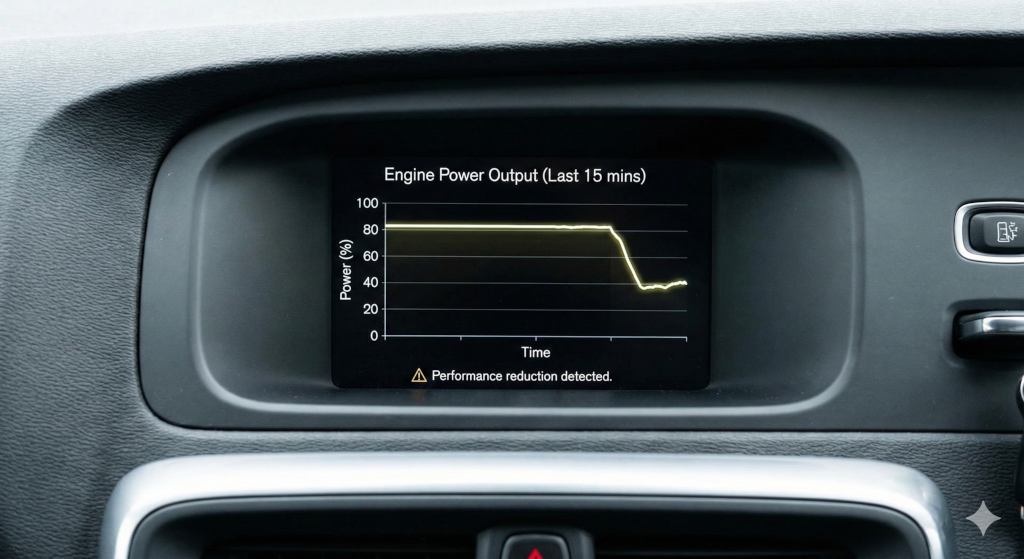
Where does alerting fit into all of this? It is the final piece of the puzzle, and the first thing to let us know something isn't right. Alerting lets us know that our metrics are out of line with our expectations, just like a check engine light.

Good alerting, built on top of good monitoring, allows us to respond quickly when real production issues arise. Combine that with good observability and we can resolve production issues before most users ever realise there was a problem.
From the field: killing the noise by making all alerts meaningful
Frequent alerts that don’t require action are dangerous. It builds a culture of ignoring alerts until one day something goes wrong that could have been prevented. We saw that risk and worked to shift the culture so that alerts meant action was needed. We did this by giving the engineers on the off-hours rotation ultimate authority over alerts.
If an alert was fired during off hours that didn't require an immediate fix, the engineer was empowered (and expected) to tune it to prevent similar false alerts in the future. By giving the people on the front lines the power to tailor the alerts, we moved from a culture of alert fatigue and ignoring the noise to a high-signal environment where an alert actually meant “we need you now.”
Improving production monitoring, observability, and alerting
Quality isn't a phase with a beginning and an end. It is a continuous process, carried out through the entire software development lifecycle. The only problem is that we often forget about that after we deploy the change to production… until something goes wrong.
So how should quality engineers influence monitoring, observability, and alerting at the right time?
Asking key questions to shape stories
Just like many other parts of a quality engineer’s influence, it starts before the first line of code is written. Whether you call it story shaping, refinement, planning, three amigos, or something else altogether, the important part is to call out what is needed during that early planning stage so it can be included in the work right from the start.
The best way to get started with this is, especially if you are new to working with an observability platform, is by asking questions like:
- How will we know this feature is actually working when it is in production?
- What does failure look like for the user and how will we know it's happened?
- How would we debug this if it went wrong at 3:00 a.m.?
Over time, as your knowledge and understanding grow, you can become more specific:
- Monitoring: Push for metrics that reflect specific outcomes, such as error rates by feature, rather than just service-wide health.
- Observability: Encourage the use of structured logs, correlation IDs, and events that describe intent (for example, payment_authorised).
From the field: a tool that evolved from a tester’s helper into a critical debugging aid
Building AI-powered products brings a whole new level of complexity to quality and testing. To help with that, a member of my team worked with the engineers in their team to create a “debug stash.” This was an extra layer of context and information that could be retrieved to understand what information the product was working with when it created its output.
Now the “debug stash” has grown into much more. It is still used by engineers for debugging as they build, but it has also been added to tracking so we can carry out analytics on the valuable data it provides. Over the years, it has been enriched, adding deeper insights. It has gone from just a feature that helped improve test automation to a critical part of our observability.
The leadership angle: cultivating a quality culture
For the leaders in the room, this section is for you. A world-class observability platform is useless if the culture surrounding it is brittle. To truly "engineer for visibility," leaders must foster an environment that treats data as an asset for understanding rather than a weapon to be deployed against imperfect people on the team.
Psychological safety as a performance multiplier
When we create a safe learning culture, one where experimentation is encouraged and incidents are treated as opportunities to learn rather than as a process that creates blame, we unlock a team’s ability to move fast. If an engineer is afraid that an alert will lead to a performance review, they will stop taking risks. A "blameless culture" ensures that when things go wrong, the focus remains on the system's failure, not the individual's mistake.
The trap of obsession with metrics
We must avoid a culture that is obsessed with the volume of metrics. More data does not necessarily equal a better understanding; in fact, it often creates "alert fatigue." As a leader, your role is to ensure the team focuses on the right metrics, those that correlate directly to user experience and business value, rather than vanity metrics that look good on a dashboard but provide no actionable insight.
Reducing the stress of on-call duty
A healthy culture recognises that on-call stress is real. By building better visibility and more accurate alerting, we aren't just protecting the product; we are protecting our people from burnout. Taking the time to build these systems is a service to the team's long-term health, ensuring they can present their best selves to the work.
To sum up
At its core, quality engineering is about removing systemic friction. In doing so we improve the experience of everyone using or working on the software.
When it comes to monitoring, observability, and alerting, this means shifting our focus from "Did we build it right?" to "Is it working right for the user?"
The key mindset shifts to take away:
- Monitoring versus observability: Monitoring tells you simply that something is broken; observability allows you to understand why it is broken without needing to ship new code to find out.
- Observability is a quality attribute: Just like security or performance, a system’s "debuggability" should be a requirement, not an afterthought.
- Alerting should be symptom-based: Guard against alert fatigue by focusing on what the user experiences. If a server is at 90 percent CPU but the user experience is flawless, the CPU usage is, for the moment, just a data point, not a pageable emergency.
- Shift left: Bring monitoring, observability, and alerting concerns into story shaping and refinement sessions. That way, we ensure that "Done" includes the ability to support the feature in the wild.
Ultimately, the most important impact we can have is reducing panic and stress when things go wrong. By ensuring we have clear metrics, easy-to-follow observability, and alerts that fire only at the right times, we transform high-pressure production incidents into events where people think clearly and provide calm, methodical resolutions.
What do YOU think?
Got comments or thoughts? Share them in the comments box below. If you like, use the ideas below as starting points for reflection and discussion.
- If your system went down at 2:00 a.m. tonight, would it take you only five minutes to understand why with your current logging, or would you spend 45 minutes guessing first?
- Does your team feel safe reporting a production "near-miss," or is there a fear of blame?
- What is one "user outcome" metric you could begin to track tomorrow that is more valuable than your current infrastructure health metrics?
For more information
- How I measure quality without looking at bug counts, Sanjeev Kumar
- We can test in production: An introduction to shifting testing right, Callum Akehurst-Ryan
- Observability in Automated Testing, João Proença
Duck enthusiast, technology leader, and quality advocate focused on building high-autonomy teams and sustainable delivery.
Comments