Bug lists tell you what. The shape can tell you why.
28 Jul 2026
In this moment:
Justin Holsgrove
Azure DevOps will happily give you a query that lists bugs, I imagine this is similar in Jira too. What it won't give you is the shape of your bugs and the shape is where the story is. We tend to track visibility of defects found in production better than those we find during development.
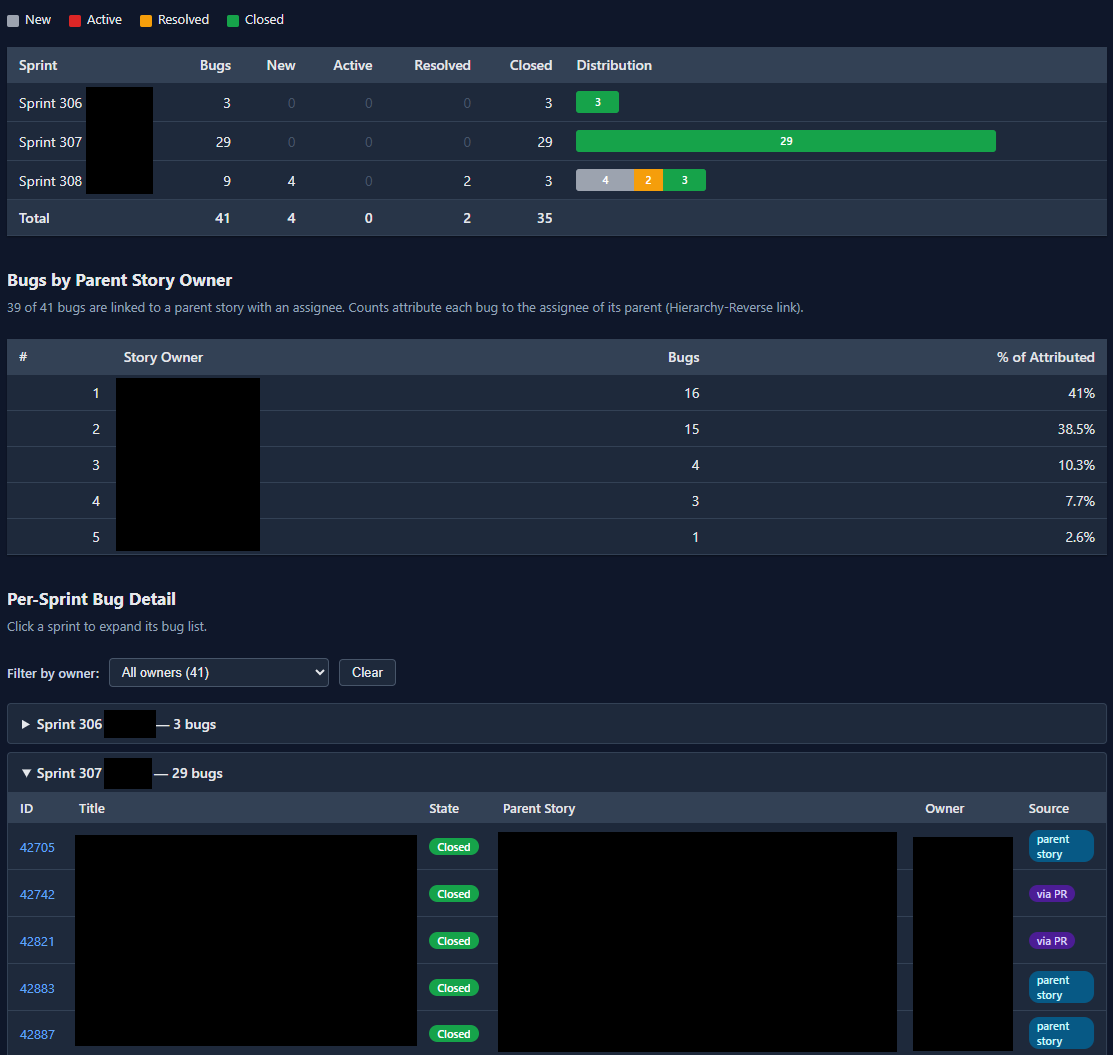
So I built a small PowerShell script that pulls every bug across all of this year's sprints and renders a single, self-contained HTML report (Thanks Claude!). Run the script and open the file... I don't host this anywhere and we'll get to why.
Zooming out is the point of it. One sprint's bug list tends to be noise and maybe some retro fodder but twenty-six sprints side by side provides more of a signal. You can start spotting patterns that individual sprint retrospectives can miss. Like the huge story that quietly bled defects for several sprints after it "finished", the hastily refined feature that generated more bugs than acceptance criteria, the CSS whack-a-mole where every fix in one browser spawned a regression in another. Retros can pick these up of course but hard data in an easily consumable format can show repeated mistakes as fact... and hopefully help remedial action get put in place.
I even spotted a trend where Claude was let loose on complex sections of the codebase, made a bunch of assumptions and caused a glut of defects, particularly when more people began adopting AI into their workflow. Now that AI is the norm, I don't really expect to be able to tell this apart anymore but we will see.
Sometimes it is just the nature of the beast of course, some sprints have harder features than others. One sprint was extended by a week so hoovers up more bug items.
Ownership, not blame. The report includes a leaderboard of bugs by owner and I want to be careful here, because the moment a chart like this exists, people can feel scrutinised.
That's not what it's for. A dev sitting at the top of the leaderboard is usually a symptom rather than a cause: they inherited the gnarliest component, or they're the one brave enough to own the legacy area everyone else avoids. The leaderboard is meant to be a conversation starter, not a scorecard. I also wouldn't want people going rogue and competing for top spot! Can you imagine?
That said I don't share it widely internally because it is all too easy for someone to misinterpret the reasoning and perhaps that is something I should change about it.
The attribution logic reflects the data though. Bugs are attributed to the parent story's owner by default - the thinking being that whoever owns the story owns its consequences. But bugs found in system testing or filed in unplanned work buckets get attributed to the PR author who actually fixed them, because the story owner had nothing to do with those.
Everything links back. Every bug ID, every parent story - one click and you're in ADO looking at the real thing. Essentially the report is a lens that allows you to drill down.
Filter by owner, collapse the sprints you don't care about, flip to dark mode. It's one script and shows how bug churn in sprints are trending this year, there are lessons to be extracted and shared with the wider team in there somewhere.
[Image shows three sprints for brevity's sake]
So I built a small PowerShell script that pulls every bug across all of this year's sprints and renders a single, self-contained HTML report (Thanks Claude!). Run the script and open the file... I don't host this anywhere and we'll get to why.
Zooming out is the point of it. One sprint's bug list tends to be noise and maybe some retro fodder but twenty-six sprints side by side provides more of a signal. You can start spotting patterns that individual sprint retrospectives can miss. Like the huge story that quietly bled defects for several sprints after it "finished", the hastily refined feature that generated more bugs than acceptance criteria, the CSS whack-a-mole where every fix in one browser spawned a regression in another. Retros can pick these up of course but hard data in an easily consumable format can show repeated mistakes as fact... and hopefully help remedial action get put in place.
I even spotted a trend where Claude was let loose on complex sections of the codebase, made a bunch of assumptions and caused a glut of defects, particularly when more people began adopting AI into their workflow. Now that AI is the norm, I don't really expect to be able to tell this apart anymore but we will see.
Sometimes it is just the nature of the beast of course, some sprints have harder features than others. One sprint was extended by a week so hoovers up more bug items.
Ownership, not blame. The report includes a leaderboard of bugs by owner and I want to be careful here, because the moment a chart like this exists, people can feel scrutinised.
That's not what it's for. A dev sitting at the top of the leaderboard is usually a symptom rather than a cause: they inherited the gnarliest component, or they're the one brave enough to own the legacy area everyone else avoids. The leaderboard is meant to be a conversation starter, not a scorecard. I also wouldn't want people going rogue and competing for top spot! Can you imagine?
That said I don't share it widely internally because it is all too easy for someone to misinterpret the reasoning and perhaps that is something I should change about it.
The attribution logic reflects the data though. Bugs are attributed to the parent story's owner by default - the thinking being that whoever owns the story owns its consequences. But bugs found in system testing or filed in unplanned work buckets get attributed to the PR author who actually fixed them, because the story owner had nothing to do with those.
Everything links back. Every bug ID, every parent story - one click and you're in ADO looking at the real thing. Essentially the report is a lens that allows you to drill down.
Filter by owner, collapse the sprints you don't care about, flip to dark mode. It's one script and shows how bug churn in sprints are trending this year, there are lessons to be extracted and shared with the wider team in there somewhere.
[Image shows three sprints for brevity's sake]

Justin Holsgrove
Senior Test Engineer/ QA Manager
He/Him
🤖 Test automator, engineer and QA Manager
✒️ testtechie.co.uk -> testtechie9.wordpress.com
🙆♂️ jholsgrove.github.io
Open To
Meet at MoTaCon 2026
Sign in
to comment

Live July 21: Build AI agents, self-heal automation & cut regression time by 90%. Register free
Explore MoT

Thu, 1 Oct
A tech conference to help you navigate the ever-shifting landscape of Quality Engineering, AI, Leadership, Product, Accessibility and Security.

Advanced prompting skills to turn AI into your trusted testing companion.

Debrief the week in Quality via a community radio show hosted by Simon Tomes and members of the community
