10 powerful tests with Chrome DevTools
Discover how to use Chrome DevTools to troubleshoot and carry out an effective testing process
"By mastering Chrome DevTools or the equivalent in other browsers, testers can significantly enhance the quality and efficiency of their testing processes, ultimately supporting faster issue resolution and a more stable user experience."
Did you know Chrome DevTools isn’t just for developers but also for testers? As a QA professional, finding bugs is essential, but understanding their root causes and suggesting solutions takes testing to another level.
If you don't use Chrome, every modern browser has an equivalent of Chrome DevTools with similar features. So you can run these tests in the browser of your choice.
To maximize the value of Chrome DevTools, testers should have some familiarity with HTML, CSS, the DOM, JavaScript, and reading network-level responses.
What is Chrome DevTools?
Chrome DevTools is a powerful web toolkit that enables you to inspect and debug websites and web applications. For testers, it offers an efficient way to inspect elements, analyze console logs, monitor network activities, and assess page performance.
Let's explore the features of Chrome DevTools that make it invaluable for testers with these 10 tests.
Test 1: Using the Elements tab to troubleshoot a spacing issue
The Elements tab in Chrome DevTools is split into two views: HTML and CSS. Right-click on any element and select Inspect, or use the arrow at the top left of Chrome DevTools to hover over any element and select it, This displays the Styles in the right panel. This allows real-time modification of HTML and CSS without needing to update the code permanently.
The screenshot below shows a page where there’s an unintended space between a divider line and a banner image. Assume this is an issue where in the design the banner image is attached to the divider line.

Figure 1: Banner image issue caused by space between divider line and image
Hover over the divider line or the banner image to capture the space area and select it. The screenshot below shows the space area inspected.

Figure 2: Hovering over the top area to capture the space
Removing the margin-bottom style from the CSS fixes the space issue.
Figure 3: Removing the margin-bottom style from CSS file fixed the space issue

As seen from the three screenshots above, you can hover over the space to capture it, inspect it, and troubleshoot the issue by adjusting the margin or padding.
Test 2: Using Inspect Element to troubleshoot an issue that impedes user navigation
In the screenshot below, the interface provides "carousel dots" for navigation of slides. However, they're only partially visible. These dots are supposed to be fully visible so users can easily select them to navigate to the next slide.
The area where the slideshow is displayed has a boundary that hides anything outside of it (a style called overflow-hidden). Because of this, the dots at the edges of the slider are cut off, making it hard for users to see or select them properly.

Figure 4: The half-hidden carousel dots in the slider
To troubleshoot this issue, simply hover over the content and you will see the green shadow overflow on the carousel dots. When you select it, you will see the related stylings on the right side.

Figure 5: Hovering over the carousel element to observe the padding's CSS value of overflow-hidden
Untick the overflow-hidden attribute and watch as the issue is resolved without changing the position of the dots.

Figure 6: Remove the overflow-hidden attribute to fix the issue
Test 3: Using the Console tab to identify Javascript errors
The Console tab is an important tool for identifying JavaScript errors, which are flagged in red, making them easy to locate. Because there are hundreds of possible error types your ability to analyse them will come only with experience. In some cases, developers attach scripts to code so that they can more easily identify any script-related faults.
You really shouldn't see any errors in the Console by the time a site is deployed to production. However, server or network issues may sometimes generate logs.
The screenshot below shows the Console error log for some broken text related to diagrams inserted into the workspace. However, this error does not occur for all users of the site. In this case, a hotfix for the particular client should be provided promptly, instead of asking them to wait for a general application-level resolution.

Figure 7: Text IDs of the broken text elements in the diagram in the Console
Test 4: Analysing error logs in the Console
In the screenshot below, from the error itself, it is obvious that the log is related to some security issue in cookie properties. Leaving this type of error unhandled may result in session management issues, inconsistencies in analytics, inconsistent application behaviours, and more. So, if the site relies on cookies or same-origin policies, this error needs to be validated and fixed.

Figure 8: A Console log error related to a security issue with cookie properties
Test 5: Finding broken links by running custom JavaScript in the Console
You can run custom JavaScript in the Console to find broken links, to clear page cache, and more.
The code snippet below checks for broken links, and the call function checkBrokenLinks() will find and display all broken links, marking them in red. It’s helpful when testing pages that are inaccessible from external networks.
// Function to check if a link is broken
 async function checkBrokenLinks() {
 	// Get all the <a> elements on the page
 	const links = document.querySelectorAll('a');

	// Loop through each link
 	for (let link of links) {
     	const href = link.getAttribute('href');

     	// Skip links with empty or non-existent hrefs
     	if (!href || href.startsWith('#') || href.startsWith('mailto:') || href.startsWith('javascript:')) {
         	continue;
     	}

    	try {
         	// Fetch the link and check the response status
         	const response = await fetch(href, { method: 'HEAD' });

         	// If the status code is not OK (i.e., not 2xx)
         	if (!response.ok) {
                 console.log(`Broken link found: ${href} (Status: ${response.status})`);
                 link.style.color = 'red'; // Optionally highlight the broken link in red
         	}
     	} catch (error) {
         	// If an error occurs (e.g., network error, or link is unreachable)
             console.log(`Broken link found: ${href} (Error: ${error.message})`);
             link.style.color = 'red'; // Highlight broken link
     	}
 	}
 }
Test 6: Using the Network tab to analyse error codes caused by specific browser actions
The Network tab logs all requests for every action taken on a page, showing crucial status codes that indicate whether an action succeeded or failed.
The screenshot below shows a HTTP 404 error code on a favicon.png file. This simply indicates that the specified file is missing. Selecting the file name provides more details, including headers and responses, which can assist in further diagnosis.
There are several HTTP status codes, which you should learn more about if you want to make good use of what you find in the Network tab.

Figure 9: HTTP 404 error code for favicon.png
Test 7: Capturing the data passed to action elements
We can investigate certain hidden information in the Network tab. In the screenshot below you can see the telephone number and email address the user entered. If there were an issue with gathering that information, you'd be able to see that the information was missing.
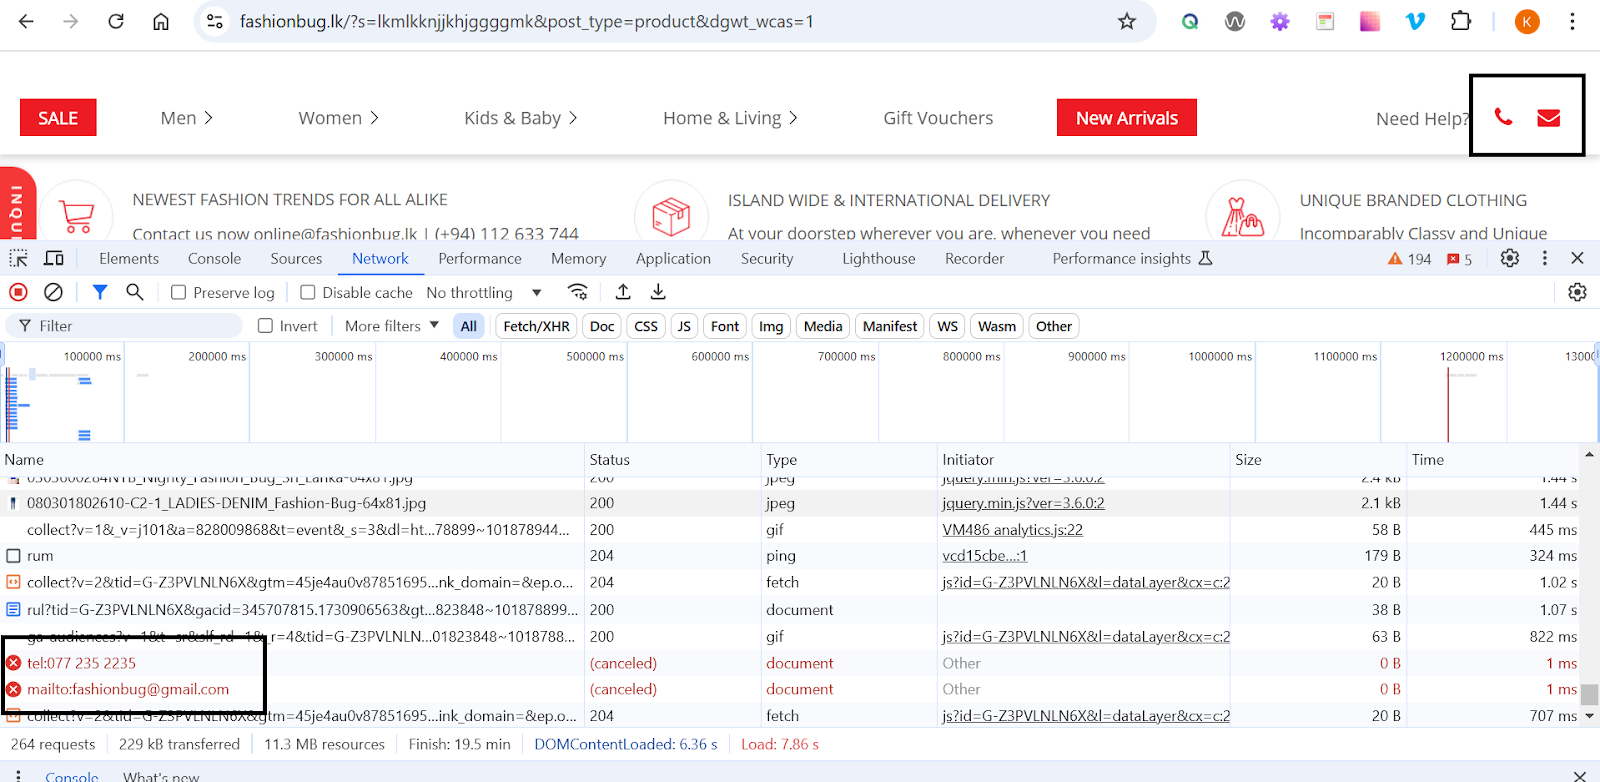
Figure 10: The telephone and email addresses linked to the icons on the top right corner of the page
Test 8: Testing offline functionality without actually disconnecting from the network
You can go into offline mode right from the Network tab. Simply select No Throttling -> Offline. This feature is helpful for testing offline functionality without disconnecting your device from the network physically.
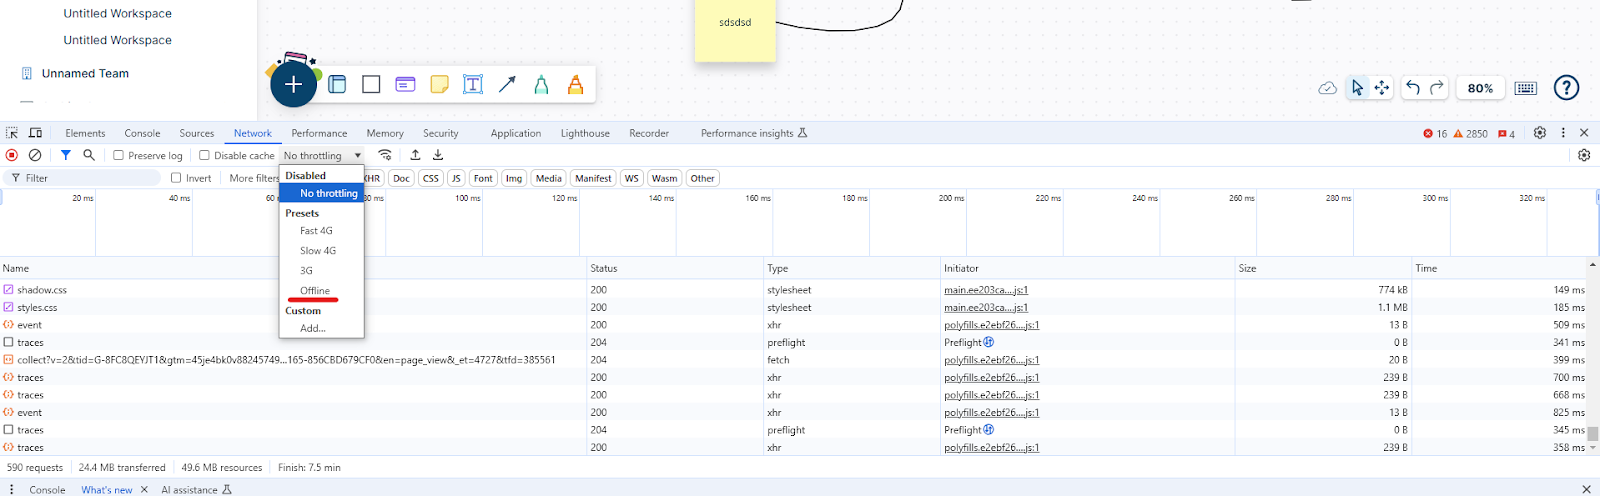
Figure 11: Selecting Offline from the No Throttling dropdown option list
Test 9: Using the Application tab to investigate data flow
In the Application tab, you can dig deeper into data-related activities. You can perform all kinds of tasks, from clearing cache to analysing the indexDB where you can get a glimpse of data associated with the UI level of the application. But to get a good understanding of the information generated in this tab you first need a little understanding of the database in use.
The screenshot below shows the authentication token in local application storage. This data can be used for certain testing purposes, like automating the functionality of the diagramming workspace.

Figure 12: Retrieving the authentication token to perform automated tests
Test 10: Retrieving the user ID to perform tests with specific user data
The screenshot below shows the userID of the created workspace in the Application tab. This is useful if you need to perform any database-related testing for this user.

Figure 13: Getting the userID of the logged-in user
To wrap up
The Elements, Console, Network and Application tabs are especially beneficial for testers working with browser-based applications, offering invaluable insights that go beyond simply identifying issues. By mastering Chrome DevTools or the equivalent in other browsers, testers can significantly enhance the quality and efficiency of their testing processes, ultimately supporting faster issue resolution and a more stable user experience.
For more information
- One Tab To Rule Them All: The Developer Tools Network Tab, Ioan Solderea
- Five Optimization And Performance Tools That Enhance Website User Experience, Kasturi Rajamanikkam
- Tiny Software Testing Tools, Big Difference In Testing Results, Andrea Jensen
- A Software Tester’s Guide To Chrome Devtools, Viv Richards

A software QA professional with around 7+ years of experience in both manual and automation testing. A keen student to learn new technologies and trends, and a passionate educator.
Comments