An Inside Job: Customising Static Code Analysis for Optimising Internal Tools
Explore the benefits of testing source code without executing the code

What is Static Code Analysis?
Static code analysis is a method of testing source code without having to execute the code.
It is usually performed by dedicated tools (for example by so-called linters), and can detect quality, compliance, security, performance, data flow, and many more types of issues.
It is beneficial because it can be performed right from when you start implementing your project, and there is no need to wait for a runnable version of the application, or at least a runnable portion of it. This makes it a great candidate for shifting testing left.
It’s important to mention that although it can detect a wide range of problems, it is not a silver bullet. It cannot detect ones (for example, dynamically calculated incorrect values) that require running the code. For that, you’ll need different techniques.
As for static code analysis checks, nowadays there are a myriad of options to implement them, but many processes seem to miss this huge opportunity of covering the specific functionality of internal tools and applications, services and test automation solutions, and on the benefits it provides.
It is quite standard to have common linter rules (the units used to describe what specific issue(s) they look for) configured in one’s applications. They can range from simple code style and formatting related ones, like whitespaces around braces, to advanced metrics like cyclomatic complexity. But why should it be any different to create custom rules for internal APIs (Application Programming Interfaces)?
Static code analysis for tools, APIs and DSLs (Domain Specific Languages) developed in-house, also coupled with integrations with IDEs (Integrated Development Environments), code editors, and real-time analysis, can have great benefits on code quality and engineering experience, which will become apparent as you read this article..
Enhancing TAS with Static Code Analysis
Let me share a short story; then I’ll dive into the whats and whys.
On a previous project, we developed a pair of internal tools. A TAS (Test Automation Solution) and a test runner on Java, Selenium and BDD (Behavior Driven Development) foundations that had a massive amount of functionality our teams could use. It was used by test automation engineers and back-end devs as well.
First, because of the volume of functionality and the various stakeholders, we had to implement static code analysis for these test DSLs to ensure that the framework would be used properly by everyone. It meant things like enforcing class naming conventions, application of Java annotations so that our custom page object classes and page element fields were picked up by the framework, or the use of proper levels and types of our custom assertions that if used incorrectly would have caused false positive test results.
Then, on top of that, our front-end developers, who had never worked with Java, decided to use it as well. So, besides making sure that the DSLs and the framework were easy to use, we had to make extra sure that they too, would use it correctly and efficiently, and would not make many mistakes.
Tools, Rules And What To Do With Them
Static code analysis can come in many forms: linters like TSLint, CLI tools, Maven/Gradle/etc. plugins like Checkstyle, IDE specific tools like Inspections and Structural Search and Replace Templates in JetBrains IDEs, languages servers, or even external tools and services like Sonar.
One major common theme among them is that they provide programming language specific analysis rules and/or rules for frameworks and libraries used by many in the IT industry. It is crucial to have such tools and services in order to ensure good code quality and safe and performant software applications.
But projects don't only use external frameworks and libraries, they develop their own ones as well, and they are used within their projects and companies, either in the same team or by other teams too.
These applications have their own rules on how they operate and how they should be used in a correct and optimal way. Those rules are not and will not be covered by general-purpose static code analysis tools.
A slightly different case of this is when your project has specific rules that deviate from industry standards, and they cannot be covered by such tools. Thus, you have to make a choice:
- You don’t implement any custom checks, but you make a conscious effort to check those rules manually at various stages of your coding and code review processes.
- If your project is not that complex or big, or the number of rules is low, this option may be enough. This option, however, can become more difficult, for example, when the number of used internal tools increases.
- If your project doesn't have enough resources to implement validation for these rules, you don't really have another option to go with.
- You look for ways of implementing those rules in a way that they fit into your current technical stack or software and test architecture. I'll share more details and benefits for this option in the next couple of sections.
Identify And Implement Your Own Internal Rules
Let's say you have the resources and also the willingness to dedicate effort to this work. How do you start?
You have to identify what rules you have, and you also have to decide on what tool or tools you'll use to implement them.
This is not a serial process: you may want to use one tool but you find out that only another tool can provide you the functionality you need. Or, rules that you previously thought could not be implemented by the tool of your choice turns out to be actually achievable based on the knowledge you gain by using that tool.
Documentation, Guides And Any Kind of Agreements
The first places you can look to identify candidates are various project documents, like coding conventions, contribution guides, best practices and similar wikis. (Let’s hope there are some, and that they are kept up-to-date. 🙂) If your team made verbal agreements on rules and conventions, that is also a good place to look for them, but you might want to formalize them in a written document.
On a previous big project, we had a dedicated Confluence page called Rules of Thumb that listed at least 40 different rules that developers and test automation engineers had to adhere to. Of that, at least 9-10 items could be implemented as static code analysis rules.
If you are interested, or you need to, you can go deeper, inspect the code base too, and read through code comments as well. They can reveal many different criteria and can provide useful information about how frameworks, APIs, DSLs, etc. are supposed to be used.
ISTQB Advanced Level Syllabus
I’ve recently been reading the ISTQB Test Automation Engineer Advanced Level Syllabus, and Chapter 4.1.2 mentions the following in terms of the success factors for TAS deployments:
“Defining usage guidelines: It is possible to write guidelines, checklists and FAQs for the usage of the TAS. This can prevent extensive support questions.”
I agree that those documents should be available, but when they also contain items that can be and are formalized into analysis rules, there is a greater chance those rules are actually adhered to, and are adhered to easier.
A Few Simple Examples For Starters
Let’s say you are testing a desktop web application on different breakpoints, let’s call them Small, Medium and Large. You have the following Cucumber steps for opening a page:
I open the X page on the Y breakpointI open the X page
The latter one defaults to the Large breakpoint, so you don’t have to specify the breakpoint name explicitly.
When you use the first version of the step, and you explicitly specify the breakpoint as Large, it becomes something to be simplified, and it can be replaced with the second version of the step, so that you have a cleaner feature file.
![A Gherkin code snippet showing the scenario Login page basics with a single step When I open the "Login" page on the "Large" breakpoint. A tooltip error message is shown on the step: 'Large' is the default breakpoint. You can use the simpler version, 'I open the [page type] page' instead](https://d8iqbmvu05s9c.cloudfront.net/ua17hohl7wnzi48zjw3k4mac2d0h)
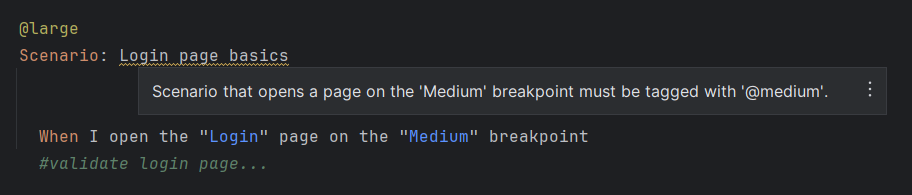
Let’s say, your team has also agreed on a core set of Gherkin tags you are going to use in feature files, for example to do filtered executions of scenarios based on breakpoint specific tags: @small, @medium, @large.
You could check whether the Scenario steps and the breakpoint tags you use match. This could help prevent including tests in a filtered execution that don’t actually belong to that group of tests.
Pull Requests And Code Reviews - A Great Place For Recurring Issues
Pull requests and other, formal code reviews are a great place to find candidates for static code analysis, especially when they are recurring, sort of like “deja vus”.
You might have found yourself in a situation where you said, or you heard others say something like:
- “Why can't people remember that…?”, or
- "I keep seeing this mistake during code reviews. Can’t we do something about it?”, and variations of them.
When this happens, make a note of that. It may be something that you can implement rules for, so that it can be handled earlier in the implementation process, and can also
- save you time and save you from annoyance by not having to report and / or receive the same pull request comments over and over again,
- help team members learn better and more optimal solutions, thus preventing them from making the same mistakes.
Overall, I think PRs are one of the most prominent places to identify them, and also where it is greatly noticeable that over time, the same issues are becoming reported less frequently and eventually not at all.
Preconditions And Exceptions
Applications and test frameworks utilize checks for various preconditions like method argument values, to make sure that tests fail fast when they encounter incorrect or invalid values and configuration.
They are often handled by if statements and different kinds of assertions, and often throw exceptions to fail the test execution. You can do a code search in your projects for different types of exceptions, and see which ones don't necessarily require runtime validation, and may also be analyzed statically too.
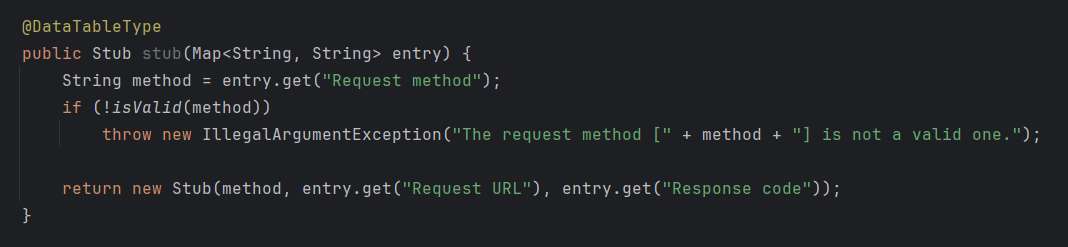
Let’s say you have a custom Stub type (details of an HTTP request-response pair to mock, on a web UI) as a Cucumber step definition method parameter, and it has its own transformation logic to create it from a data table.
The related Cucumber data table transformer maybe something like this:
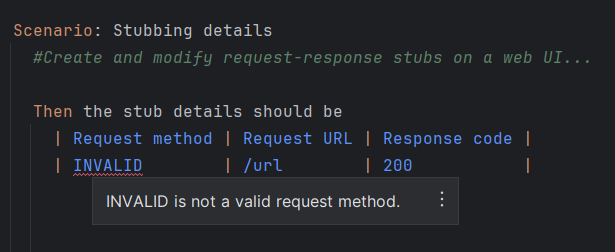
And then, the corresponding Gherkin data table and code analysis could report the following:
Boundary Value Analysis
This is an ISTQB classic, and the following ones are a few simple examples and places where you can apply it for code analysis.
- Numbers only in a certain range are allowed to be specified.
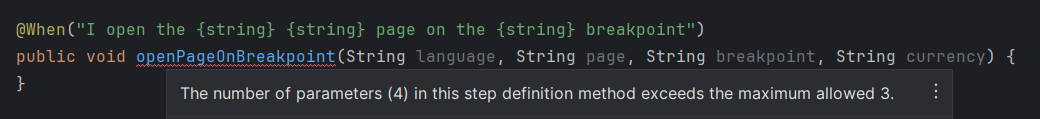
For example, the count value in a @Retry(count = <retry count>) annotation must not exceed a pre-approved amount. - There is a min/max allowed number of elements, arguments, etc.
For example, the number of parameters passed into Cucumber step definition methods must not exceed a certain number.
Default Input Values And Convenience Methods
Items in this category may be low-hanging fruits, but using convenience methods, simpler Cucumber steps, and not explicitly specifying default values can lead to simpler and more readable test code.
These items may be:
- Default function and step argument values, attributes, etc., when the IDE doesn't already report them, or it cannot report them due to specificity to a library.
Good candidates for this are, among others, methods of builder classes. - Overloaded functions with different parameter lists that have alternatives to hide default values of certain parameters. (This is applicable rather to languages that don't have a way to define default function argument values.)
- Method calls, or combinations of them, that can be replaced with more convenient, possibly shorter ones, that provide the same functionality, but with a more specific name and with the same-length or a shorter parameter list.
One very simple example is the perform() method on Selenium’s Actions class which is a convenience method for calling build().perform().
The list of techniques and places mentioned above is not comprehensive; there may be many more ways to find candidates for static analysis.
Choosing the Right Tools
I generally would say that the tool itself doesn't necessarily matter that much, as long as it provides the feature set to implement your rules with and validate against them, and you and your team are comfortable using that tool.
They may be custom rulesets in Checkstyle, PMD, linters, external services like Sonar, or IDE specific features like Inspections in JetBrains IDEs.However, what I find very useful is having a way to display the errors reported by these rulesets within the IDE or code editor on your code, right as you code.
This has many added benefits over issue reporting during build-time, or later, for example, on pull requests:
- As you code, you see immediately that there is a code quality issue that needs your attention.
- You see exactly what part of the code has a problem, based on what is highlighted or underlined in the editor. You can also see the severity / importance of the issue based on the style of the highlighting. It may be a critical error or simply a suggestion.
- People have the tendency to make the same mistakes over and over again, and code in the same way, unless they are (properly) reminded to use more optimal coding techniques or use project standards.
Seeing issues as you code by having that code highlighted accordingly can form better coding habits, form new reflexes or reinforce existing ones. This can then lead to less coding errors in the future, better trust in your code by yourself and by others. - In many cases, IDEs and code editors also provide so-called quick fixes that can be applied on the reported parts of the code, ranging from cosmetical fixes to serious, security related ones.
By using those quick fixes you can make sure that issues are addressed right away as they are reported, and you don't necessarily have to think about how to actually implement the fix for them. It can also result in less work for others, for example during code reviews.
One final aspect to consider when choosing a tool / solution is to have a central location where the rules are implemented and stored so that upon any necessary modification or extension of them, you won't have to do those modifications in all of your applications.
Such a solution may be a separate repository / package used as a dependency, if possible, an IDE plugin or something entirely else.
Is Static Code Analysis Worth It?
I cannot speak for everyone and every project; it depends on many factors. But, I can speak from experience that they can make a difference in code quality, the way engineers work, and the ways they identify and fix issues. It also results in more trust in the codebase, faster coding process, and the list could go on and on.
If you have personal experience on this topic, please share. I’d be more than happy to hear about them.
For More Information
- Static Program Analysis - Wikipedia
- The Hidden Treasure Of Static Analysis: Finding Risks In Forgotten Places - Hilary Weaver
- Digging In: Getting Familiar With The Code To Be A Better Tester - Hilary Weaver
- Three Ways To Measure Unit Testing Effectiveness - Eduardo Fischer dos Santos
- Dynamic Security Testing Your Web Application API - José Carréra

I develop JetBrains IDE plugins for test automation tools like WireMock, Mockito and others. I'm also a former QA and Test Automation Engineer of more than 10 years.
Comments