Beyond data generation: How I learned to trust synthetic data in performance testing
Apply a four-dimension framework to assess whether synthetic data can be trusted for performance testing.

A few years ago, I was running what I thought were solid performance tests. The dashboards looked perfect: throughput graphs were steady and response times were well within expected range. Then the release went live in production, and everything fell apart.
We traced the issue for days before we realized that the culprit was not in the code or the infrastructure. It was the data. Our test environment was running on safe, sanitized, heavily reused datasets that no longer reflected real production use. We had built flawless tests on a broken baseline.
That was the moment I stopped thinking of synthetic data as a compliance workaround and started seeing it as the key to performance realism. But learning to trust it was the real engineering challenge.
Generating data is easy: Making it behave like production data is difficult
Most performance testers think generating synthetic data is the hard bit. It is not. You can generate millions of rows in a few hours using open source libraries or Python scripts. The real problem is what comes after. How do you know that the data you generated actually behaves like production data?
When we rely only on random data generation, we miss patterns that make performance tests meaningful: concurrency bursts, seasonal spikes, user bias, or that one API endpoint everyone abuses. If you don't consider those patterns, your load tests become synthetic lab experiments. The goal of synthetic data is not volume, it is accuracy, and to reach that, we need validation.
The hidden gap in performance testing: Continuous fidelity to production
Synthetic data can easily become a black box. You feed it into your test suites, get perfect results, and yet users still report sluggish experiences after deployment. Even the "best" synthetic data decays over time in fidelity with respect to production usage.
In one project, we discovered our datasets had drifted so far from reality that even basic queries returned uniform response times. Every run was predictably smooth. But that is not how production behaves. The issue was not the tool or the test plan. It was that our synthetic data had lost its character.
This realization led me to what I now call The Four Dimensions of Synthetic Data Validation, a framework to measure whether generated data can be trusted for performance testing.
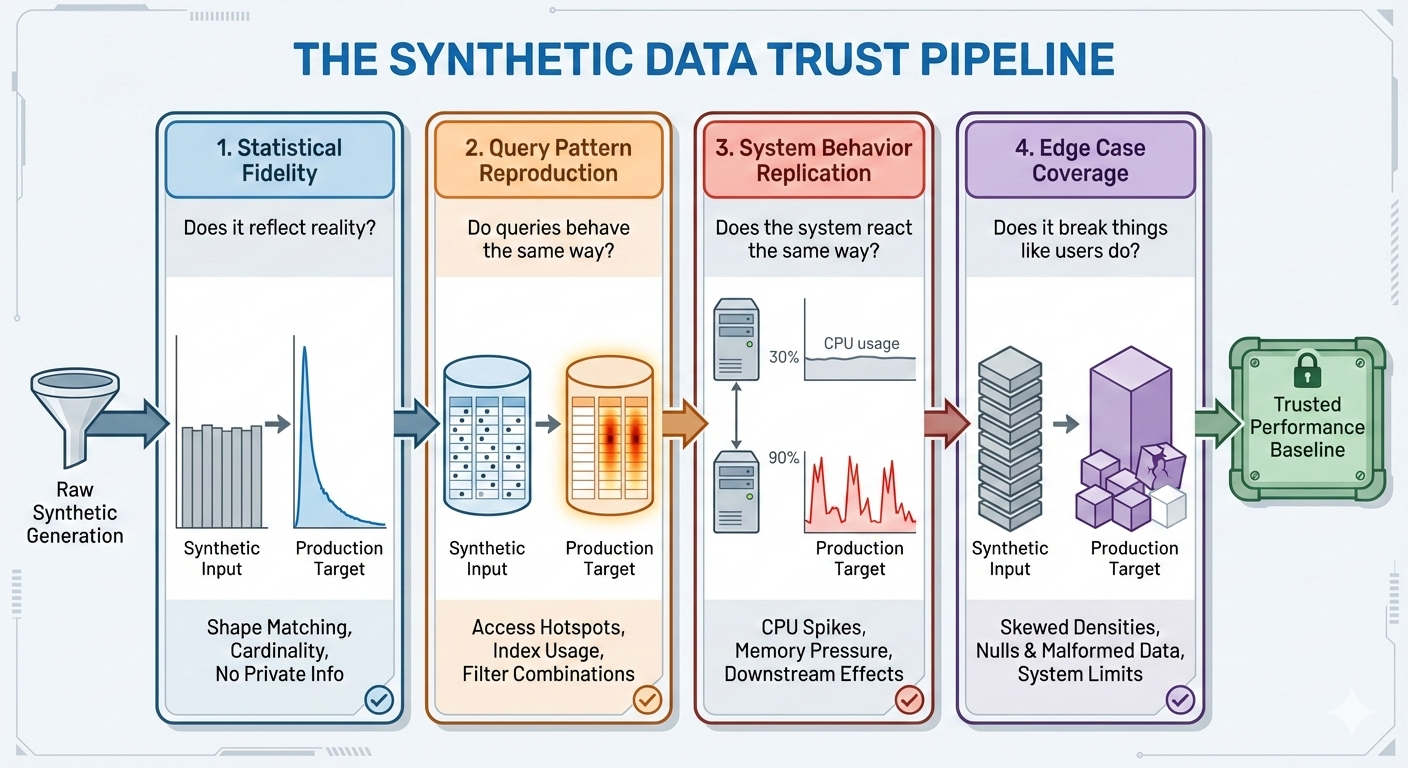
1. Statistical fidelity: Does the data reflect reality?
The first dimension is the most fundamental: statistical fidelity. It is not enough for synthetic data to look random. It must behave like real data. This means your distributions, cardinalities, and correlations should mirror what is observed in production without leaking any private information.
To validate fidelity, I started comparing real and synthetic datasets at an aggregate level. Instead of matching values, I compared shapes: frequency distributions, standard deviations, and outlier ratios.
For example, in one system, production data showed that roughly 70 percent of users interacted with one primary feature, around 20 percent used two to three features, and the remaining 10 percent were power users who used many features frequently. Our initial synthetic dataset produced a near-uniform distribution, which looked reasonable but resulted in query plans and cache behavior that were very different from their production counterparts. After recalibrating the generator to match the observed distribution ranges, query execution times and index usage began to resemble production behavior much more closely.
When these shapes aligned, we could finally say, “Our data reliably behaves like production.”
2. Query pattern reproduction: Do queries behave the same way?
Even with statistically accurate data, performance tests can mislead you if query patterns differ. Real systems do not hit every record equally. They have hotspots, or certain combinations of fields, joins, or filters, that dominate usage.
So I started capturing query logs and analyzing frequency distributions of access paths. In one application, we found that nearly 40 percent of queries filtered on the same two columns, even though the schema allowed dozens of filter combinations. Our synthetic dataset originally spread values evenly across all fields, which caused the database optimizer to choose execution plans very different from production. After adjusting the synthetic data to reproduce those high-frequency filter combinations, the same indexes were selected and query latency profiles began to match what we saw in production.
When query execution patterns for real and synthetic data began to look similar (same indexes, same caching behavior, and same average latencies) we had our first real proof of equivalence.
3. System behavior replication: Does the system react the same way?
Even if your test data looks statistically identical to production, your system might not react the same way to it. We once had a synthetic dataset that passed every validation metric but still failed to trigger a database connection pool exhaustion scenario. The reason was simple: the synthetic users had perfectly even activity rates: no peaks, no spikes, no real-world contention.
System behavior validation meant we had to measure downstream effects. For example, under production load, CPU utilization showed sharp spikes during peak usage windows, followed by recovery periods. Our synthetic tests initially produced smooth CPU curves with no visible contention. After introducing "bursty" user activity and skewed access patterns into the synthetic data, CPU and memory utilization began showing the same spike and recovery patterns as those in production. Thread contention and lock wait times increased during peaks, and cache hit ratios and eviction behavior aligned with production telemetry (the automatic collection of runtime signals that show how a system behaves while it is operating).
When the system reacted the same way under synthetic and real workloads, we knew we were finally testing something real.
4. Edge case coverage can break the system the way users do
No dataset is complete without its troublemakers. Edge cases, null values, inconsistent encodings, and rare combinations are where performance problems hide.
I began constructing corner-case suites of synthetic data designed to provoke system limits. These included intentionally malformed payloads, extremely large records, and skewed relationship densities, such as one customer who was associated with thousands of transactions.
The goal was not to mimic normal behavior, but to ensure our test harness could explore the system’s boundaries. This dimension often revealed issues that no standard load test could catch, including database deadlocks, infinite loops, and memory pressure under abnormal correlations.
Catching the drift before it catches you
Over time, I realized that even well-validated synthetic data does not stay valid forever. Systems evolve. Schema definitions change. Application usage patterns shift.
I started building a lightweight drift detection mechanism. It periodically compared new production data characteristics against synthetic data metrics, including distributions, cardinality, correlations, and null values.
In one case, we observed that optional metadata fields appeared in less than 5 percent of production records when the synthetic dataset was first generated. Several months later, production usage had increased that figure to nearly 18 percent. Our synthetic dataset still reflected the older pattern. As a result, recent performance tests failed to reproduce memory pressure scenarios seen in production. Once the synthetic data was regenerated to reflect the updated field usage, the tests once again triggered the same memory and garbage-collection behavior.
Learning to measure what you cannot see
One of the most common objections I hear is, “We cannot compare synthetic and real data because production data is confidential.” That is true. But you do not need access to raw production records. You only need aggregated metrics.
We extracted anonymized statistics such as counts, histograms, and percentiles from observability dashboards and used those as our reference. Even without seeing a single user record, we could ensure our synthetic population behaved statistically like the real one.
Trust comes from testing the data itself
For a long time, I treated test data as a static asset, something you create once and reuse until it breaks. But I have learned that synthetic data requires its own lifecycle. Now, every dataset we generate goes through a validation pipeline before being certified performance test ready. That pipeline checks for:
- Distribution drift: Are the shapes of key metrics changing over time?
- Schema consistency: Have new columns or relationships appeared that could affect joins?
- Behavioral parity: Do synthetic and real traffic produce similar telemetry patterns?
By treating synthetic data as a first-class citizen in the performance test ecosystem, something that can be validated, versioned, and observed, we have turned it from a compliance artifact into a performance enabler.
Synthetic Data Trust Framework: A framework you can reuse
After several projects, the validation process matured into a repeatable framework that other teams could adopt:
- Profile the real system: Gather anonymized statistics from observability tools (percentiles, histograms, frequency counts).
- Generate synthetic data: Use those metrics as boundaries for your data generation model.
- Validate against the four dimensions: Check statistical fidelity, query pattern reproduction, system behavior replication, and edge-case coverage.
- Monitor for drift: Continuously compare synthetic telemetry with real system logs.
- Re-calibrate periodically: Regenerate data when drift exceeds tolerance levels.
This framework turned what used to be a one-off exercise into a sustainable practice. It gave teams a language to talk about synthetic data quality without stepping into privacy concerns.
Lessons I learned along the way
- You cannot fix what you do not measure. If you are not validating synthetic data, you're assuming correctness by faith.
- Synthetic data isn't fake data. When built and validated properly, it's predictable data.
- Validation builds culture. Teams start to value test realism when they see that data itself can be engineered, measured, and improved.
- Maintenance is part of the design. Drift isn't failure, it's evolution. Plan for it.
These lessons took months of trial and error, and a lot of test reruns, to internalize. But they changed how I think about test data entirely.
To wrap up: Beyond generation
The day our baseline broke was frustrating, but it was also the start of something better. Today, I no longer measure success by how fast we can generate data, but by how much we can trust it.
Performance testing isn't just about systems anymore. It's about the realism of the stories our data tells. When synthetic data starts mirroring those stories, with all their messiness, quirks, and edge cases: that's when you know your testing is not synthetic anymore, it is real.
What do YOU think?
Got comments or thoughts? Share them in the comments box below. If you like, use the ideas below as starting points for reflection and discussion.
Questions to discuss
- How confident are you that your current performance test data behaves like production under load?
- What signals would tell you that your synthetic data has drifted from reality?
- Which system behaviors do you trust the least today: CPU, memory, or query performance?
Actions to take
- Compare production and synthetic data shapes for one critical dataset at an aggregate level.
- Identify one high-frequency query pattern and validate that it behaves the same way under synthetic load.
- Add a simple drift check to your test pipeline, even if it tracks only one or two metrics.
For more information

Performance Engineering Architect | 17+ yrs in scalable systems, observability | AI testing | Built JMeter-on-K8s | Synthetic Data frameworks | Speaker contributor in QA innovation
Comments